Visual Cinnamon
Created in 2017

- BETA

To investigate (B)
Some signals may appear as inconsistent with a regular activity Social networks
47,019 603Activities
Technologies
Entity types
Location
Bennekom, Netherlands
Bennekom
Netherlands
Employees
Scale: 1 employee
Estimated: 1
Engaged corporates
3
0 1Added in Motherbase
2 years, 8 months ago
Value proposition
Transforming Data into Insightful and Stunning Visuals for Maximum Impact
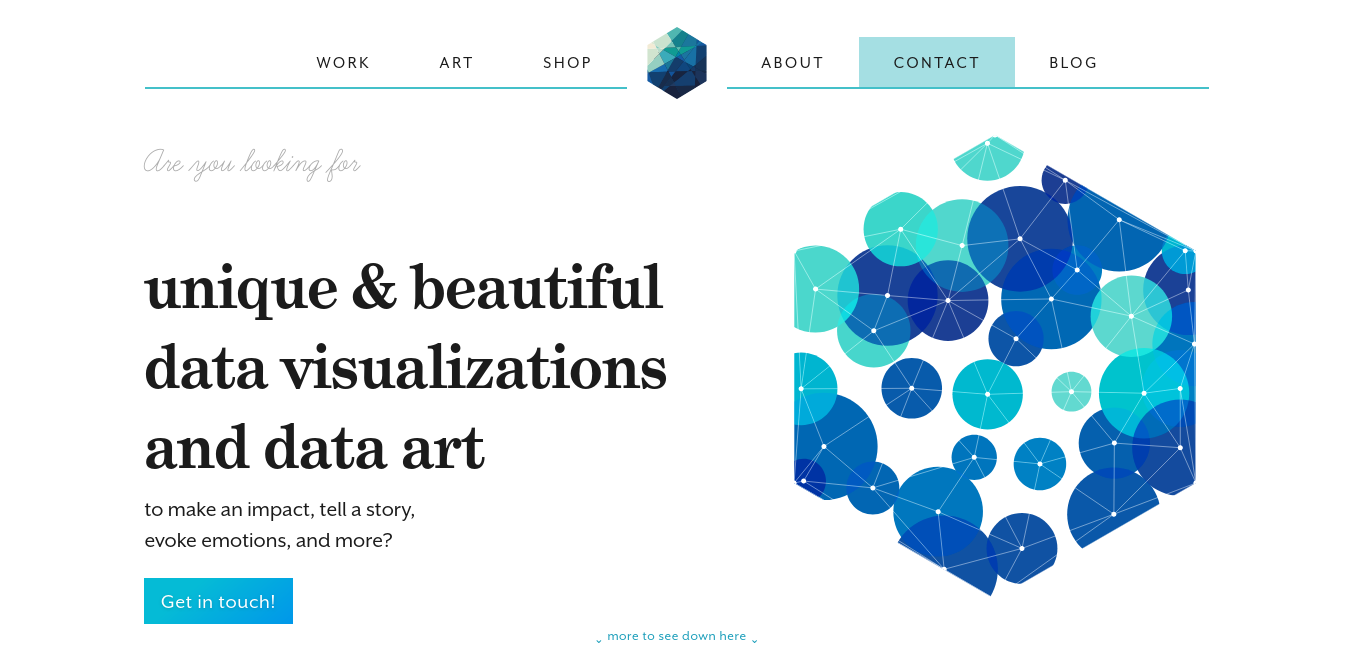
Visual Cinnamon is an award-winning boutique data visualization and data art studio dedicated to transforming data into insightful and stunning visuals. Founded by a former Astronomer and Data Scientist, Visual Cinnamon brings a unique perspective to data storytelling, combining technical expertise with artistic creativity.
Since its inception, Visual Cinnamon has received numerous accolades, including the Rising Star award and Best Individual in the "Information is Beautiful Awards". Our portfolio includes collaborations with small start-ups, renowned publications like Scientific American and The New York Times, and global multinationals such as Google, Sony Music, UNICEF, and UNESCO. We help clients uncover the hidden stories within their data, whether online or in print, through both static and interactive visualizations.
At Visual Cinnamon, we strive to captivate and engage audiences with the insights revealed through data. Our custom-built visualizations are designed to be both beautiful and effective, starting from the actual data and goals, rather than relying on pre-made charts. This approach ensures that each project is unique and tailored to the specific needs and objectives of our clients.
In addition to creating traditional data visualizations, we also specialize in data art and branding material, turning numbers into visually striking pieces that hint at the underlying patterns within the data. Our services cover the entire data visualization process, from data analysis to design and creation of the final stand-alone piece.
We also offer consultation services, advising your dashboard and front-end developers or analysts on the best practices in data visualization design. Taking their work one step further to make it more effective and memorable.
Get in touch to discuss how we can help your organization harness the power of data through stunning and insightful visualizations. Please email us at info@visualcinnamon.com to learn more.
Data Visualization, Data Analysis, Data Art, D3.js, Data Science, Storytelling, Graphic Design, Public Speaking, Data Storytelling, Infographics, Data Design, Information Design, Visual Analytics, Data Communications, Data-Driven Insights, and Creative Data Solutions
An Award-winning Data Visualization Designer | Visual Cinnamon
Visual Cinnamon | Data Visualization Design & Data Art | Data made insightful, effective & beautiful through data visualization and data art
https://www.visualcinnamon.com/

| Corporate | Type | Tweets | Articles | |
|---|---|---|---|---|
 Microsoft IT services, Software Development | Microsoft IT services, Software Development | Other 29 Jun 2018 | | |
 Visa Finance, IT Services and IT Consulting | Visa Finance, IT Services and IT Consulting | Other 24 Oct 2021 | | |
 NASA - National Aeronautics and Space Administration Research, Aviation and Aerospace Component Manufacturing | NASA - National Aeronautics and Space Administration Research, Aviation and Aerospace Component Manufacturing | Other 3 Apr 2020 | | |